| 
|
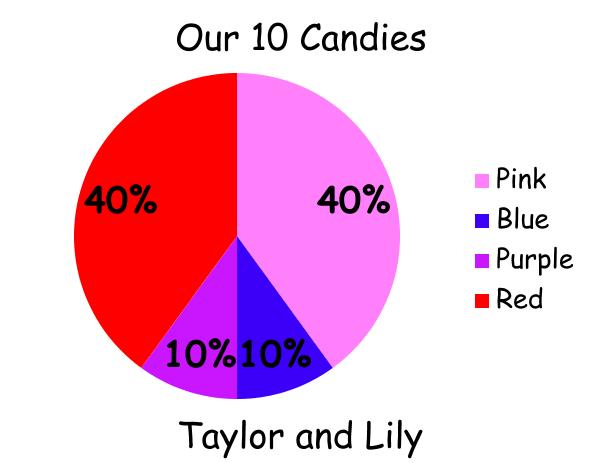
Today in class we made two graph's about the lesson we learned yesterday. We used a website called Create a Graph. If you want to make one, here is the link.- http://nces.ed.gov/nceskids/createagraph/default.aspx?ID=b2da4fe131c445c2acdd032a3fe3faed. We learned how to make circle graphs, and that the number of people you survey is not a number, its just the claims you make.
The one on the left is a graph is just the ten candies that me and Lily got. That one was not very accurate, because we only had one tenth of the candies out of one hundred candies.
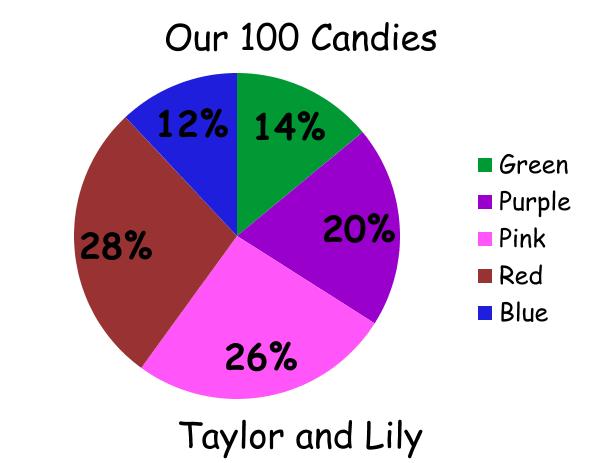
The one on the right is more accurate, because we knew what all the candies were. Also we surveyed all the claims we made.
The one on the left is a graph is just the ten candies that me and Lily got. That one was not very accurate, because we only had one tenth of the candies out of one hundred candies.
The one on the right is more accurate, because we knew what all the candies were. Also we surveyed all the claims we made.
 RSS Feed
