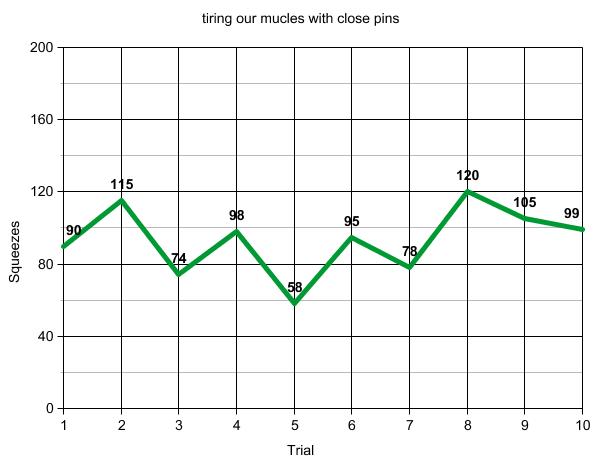
i personally think that the thought of having to get a clothespin click it around 100 times in 30 seconds is just flat out tiring.
questions 1) Is there a pattern to your data table or graph? Do the numbers increase, decrease, or stay the same? Explain. (2) Does your partner's data show a similar pattern to your own? Explain. (3) What could these patterns in your table or graph indicate? (4) Are your results reliable? Is there anything you could have done to make your results more reliable? Explain. | answers1. it only goes up & down for a few times but that's really the only thing that would qualify as a pattern 2. no my partners graph does not at all look like my graph ( his is more smooth while mine is "bumpy"). 3. that I get tired when doing this activity or that I'm out of shape. 4. I really don't think so. I think I did everything right tire myself out by tenfold "check" make one accurate graph "check" make a blog on this unit "check" |
 RSS Feed
